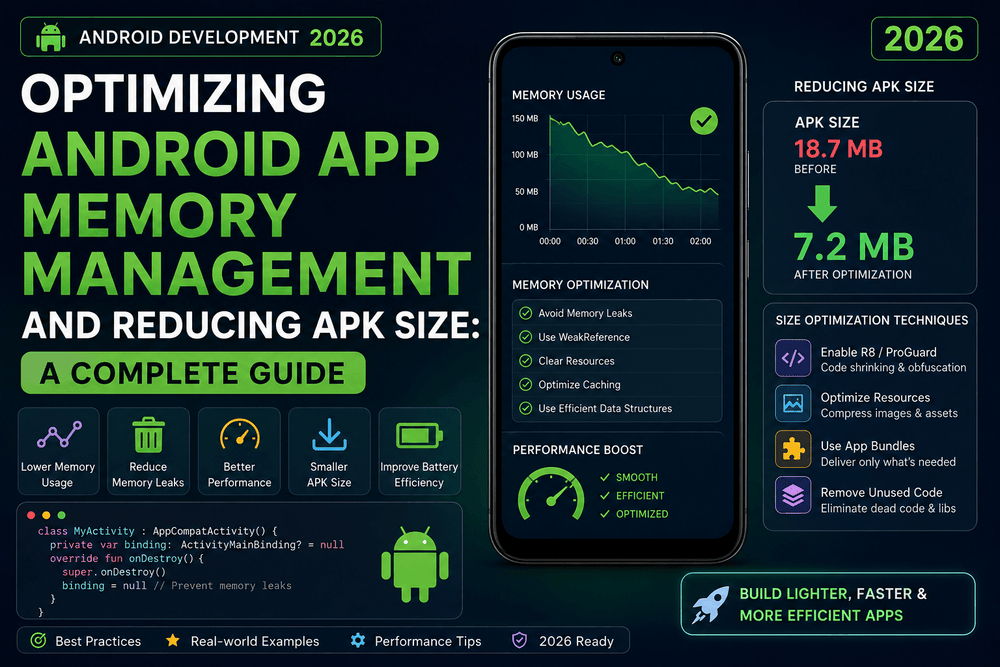
Optimizing Android App Memory Management and Reducing APK Size A Complete Guide 2026
Optimizing Android App Memory
Android application performance is influenced by many factors, but two areas deserve particular attention: memory management and application size. An app that consumes excessive memory can become slow, unstable, or vulnerable to crashes, while an unnecessarily large APK can take longer to download, install, and update.
For developers, optimizing an Android application is not simply about making benchmark numbers look better. Good optimization improves the experience for real users, particularly those using devices with limited storage, memory, or network bandwidth.
Android provides extensive tools and documentation for identifying memory problems, analyzing application size, and improving performance. Google’s Android Developers documentation recommends profiling applications to identify actual performance problems rather than relying on assumptions.
This guide explores practical ways to improve Android app memory management, reduce APK size, optimize resources, and build applications that remain responsive as they grow.
Why Android Memory Management Matters
Every Android application operates within a memory environment with limited resources.
Your app may need memory for:
- UI components
- Images
- Lists
- Network responses
- Database objects
- Caches
- Background tasks
- Third-party libraries
- Application state
If memory consumption becomes excessive, Android may terminate processes to recover resources. Developers therefore need to avoid unnecessary allocations and memory leaks.
Memory optimization is especially important for applications that handle large images, multimedia, maps, databases, or long-running background operations.
A common mistake is assuming that an application will automatically perform well simply because it works correctly on a developer’s device.
Real users may have very different hardware.
Understanding the Android Memory Model
Android applications run on the Android Runtime (ART), which uses automatic memory management and garbage collection.
Developers do not normally manually free objects as they would in languages that require explicit memory management.
However, automatic garbage collection does not mean memory management can be ignored.
If an application keeps references to objects that are no longer needed, those objects may remain in memory longer than necessary.
This is commonly associated with memory leaks.
For example, holding a reference to an Activity from a long-lived object can prevent that Activity from being garbage collected after it is destroyed.
The result may be increasing memory usage over time.
Common Causes of Android Memory Problems
Several patterns frequently contribute to unnecessary memory usage.
Large Images
Images can consume significant amounts of memory when decoded.
For example, a high-resolution photograph may occupy considerably more memory in RAM than its compressed file size suggests.
A 4 MB image file does not necessarily require only 4 MB of memory when decoded.
This is why image-heavy applications should carefully manage image loading and caching.
Memory Leaks
A memory leak occurs when an object remains reachable even though the application no longer needs it.
Common sources include:
- Long-lived static references
- Incorrect Activity references
- Improper listeners
- Unregistered callbacks
- Poorly managed lifecycle components
- Some third-party libraries
Android Studio provides profiling tools that can help developers investigate memory usage and identify potential problems.
Excessive Object Creation
Creating large numbers of temporary objects can increase garbage-collection activity.
For example, repeatedly creating unnecessary objects inside a frequently executed loop can increase memory pressure.
Optimization should focus on meaningful problems rather than eliminating every object allocation. Modern runtimes are efficient, but unnecessary allocations can still matter in performance-sensitive areas.
Use Android Studio Memory Profiler
One of the most valuable tools for Android memory optimization is Android Studio’s Memory Profiler.
It can help developers observe:
- Heap usage
- Allocated objects
- Garbage collection activity
- Memory growth
- Potential leaks
- Application memory behavior over time
Instead of guessing why an application consumes memory, developers can reproduce a scenario and inspect what happens.
For example, you could:
- Open an Activity.
- Navigate to another screen.
- Return to the previous screen.
- Repeat the process.
- Monitor memory usage.
- Look for unexpected growth.
- Investigate retained objects.
Android’s official profiling documentation provides guidance on using Android Studio’s profiling tools to understand application behavior.
Avoid Holding References to Activities
Activities have lifecycles.
They can be created, destroyed, and recreated during the lifetime of an application.
Therefore, long-lived objects should generally avoid holding unnecessary references to Activity instances.
For example, be careful with patterns involving:
object AppManager {
    var activity: Activity? = null
}
A global object that stores an Activity reference can potentially keep the Activity alive longer than intended.
Instead, use lifecycle-aware architecture and application-level dependencies where appropriate.
Use ViewModel for UI State
For modern Android applications, ViewModel provides a lifecycle-aware place to store UI-related state.
Rather than keeping complex state directly inside an Activity, a ViewModel can manage that state.
For example:
class ProductViewModel : ViewModel() {

    private val _products = MutableStateFlow<List<Product>>(emptyList())

    val products = _products.asStateFlow()
}
This architecture can help separate UI state from Activity or Fragment instances.
ViewModel is not a universal solution for memory management, but it can help developers avoid placing long-lived application logic directly inside short-lived UI components.
Optimize Image Memory Usage
Images are among the most common sources of excessive Android memory consumption.
If an ImageView displays a small thumbnail, loading an enormous original image is unnecessary.
For example, if an image is displayed at approximately 300 × 300 pixels, loading a 5000 × 5000 image wastes memory and processing resources.
Use appropriately sized images and modern image-loading libraries that support resizing, caching, and efficient decoding.
Popular Android image-loading solutions include libraries such as Coil and Glide.
The principle is simple:
Load only the image resolution your UI actually needs.
This can reduce memory consumption, improve scrolling performance, and decrease network usage.
Use Efficient List Rendering
Applications often display lists of products, messages, articles, or social posts.
Loading hundreds or thousands of complex views simultaneously can increase memory usage.
Instead, use efficient list components such as RecyclerView for traditional Android Views or lazy components such as LazyColumn and LazyRow with Jetpack Compose.
RecyclerView reuses item views rather than creating an entirely new view for every item.
For Jetpack Compose, lazy layouts compose items as needed rather than rendering the entire dataset at once.
This is particularly important for applications displaying large collections of content.
Be Careful with Caching
Caching can improve performance by avoiding repeated network requests or expensive calculations.
However, an unlimited cache can consume large amounts of memory.
A good cache should have sensible boundaries.
Consider:
- Maximum size
- Expiration policy
- Memory versus disk storage
- Cache invalidation
- Lifecycle
- User behavior
For example, frequently accessed small objects might be suitable for memory caching, while large files may be better stored on disk.
The goal is not to eliminate caching.
The goal is to cache intelligently.
Understanding APK Size
Memory usage and application size are different optimization areas.
An APK contains application resources and compiled code required to install and run an Android application.
Large application packages can increase:
- Download time
- Installation time
- Storage usage
- Update size
- User abandonment during installation
Android developers should therefore consider application size as part of overall application quality.
Google provides official guidance for reducing application size and analyzing APK or app bundle contents.
APK vs Android App Bundle
When discussing Android application size, it is important to distinguish between APK files and Android App Bundles.
The Android App Bundle (AAB) is a publishing format that allows Google Play to generate optimized APKs for individual devices.
Instead of delivering every resource and architecture-specific file to every device, Google Play can generate a more targeted package.
This can reduce the amount of data users need to download.
For applications distributed through Google Play, developers should understand how App Bundles and Play delivery affect final download size.
The Android Developers documentation provides current information about publishing and app bundle configuration.
Enable R8 for Release Builds
One of the most important techniques for reducing Android app size is code shrinking.
Android’s R8 tool can perform code shrinking, optimization, and obfuscation for release builds.
R8 can remove unused code and resources when configured appropriately.
A typical release configuration may include:
android {
    buildTypes {
        release {
            minifyEnabled true
            shrinkResources true
        }
    }
}
The exact configuration depends on the project’s Gradle setup and Android Gradle Plugin version.
Developers should always test release builds thoroughly after enabling shrinking because some libraries or reflection-based systems may require additional configuration.
Android’s official documentation provides detailed guidance for optimizing app size with R8 and resource shrinking.
Remove Unused Resources
Large Android applications often contain resources that are no longer used.
These can include:
- Images
- XML layouts
- Icons
- Fonts
- Localization resources
- Animation files
- Old assets
Unused resources increase project complexity and may increase application size.
Resource shrinking can help remove unused resources in release builds, but developers should also periodically review the project manually.
A clean resource directory is easier to maintain and reduces unnecessary application content.
Optimize Images and Assets
Image files can contribute significantly to application size.
Developers should consider:
- Appropriate image formats
- Correct image dimensions
- Vector drawables where appropriate
- Compressing raster images
- Removing duplicate assets
- Avoiding unnecessarily large source images
For simple icons and shapes, vector drawables can sometimes be more efficient than storing multiple raster versions.
However, vectors are not ideal for every type of image.
Photographs, complex textures, and detailed artwork may be better represented using appropriate raster formats.
The correct choice depends on the asset.
Use Resource Qualifiers Carefully
Android supports resource qualifiers for different configurations and device characteristics.
For example:
drawable/
drawable-hdpi/
drawable-xhdpi/
drawable-xxhdpi/
drawable-xxxhdpi/
Historically, applications often included multiple raster versions of the same image.
Modern Android tooling and delivery mechanisms can reduce the need to deliver every resource to every device.
However, developers should still review whether duplicate resources are necessary.
Avoid keeping obsolete density-specific assets simply because they were added years ago.
Review Dependencies
Third-party libraries can add functionality, but they can also increase application size.
A project may accumulate dependencies over several years.
Some may no longer be used.
Others may provide functionality that is duplicated elsewhere.
Review your dependency list regularly.
Ask:
- Is this library still required?
- Is it actively maintained?
- Is there a smaller alternative?
- Are we using only a small portion of a large library?
- Is the dependency introducing duplicate functionality?
Removing an unnecessary dependency can improve both maintainability and application size.
Do not remove dependencies solely because they add a few kilobytes, however. Security, reliability, maintainability, and functionality should remain important considerations.
Avoid Duplicate Libraries
Dependency conflicts can sometimes result in multiple versions of similar components being included in a project.
Use Gradle’s dependency analysis tools to understand your dependency graph.
Keeping dependencies organized can prevent unnecessary duplication and make application builds more predictable.
This is particularly important for large Android applications with multiple modules.
Modularize Large Android Applications
As an Android application grows, modularization can improve organization and build performance.
For example:
app
│
├── feature-home
├── feature-profile
├── feature-settings
├── core-network
├── core-database
└── core-ui
Modularization does not automatically make the final APK smaller.
However, it can make it easier to understand dependencies and manage features.
Combined with modern Android build and delivery strategies, modular architecture can support more efficient development and feature delivery.
Dynamic Features for Large Applications
Applications with optional functionality may benefit from dynamic feature delivery.
For example, imagine an application that has:
- Main functionality
- Advanced photo editing
- Professional reporting
- Offline maps
Not every user may need every feature.
Dynamic feature modules can allow certain functionality to be delivered separately when appropriate.
This can improve the initial installation experience for suitable applications.
The exact suitability depends on the application’s distribution strategy and requirements.
Use Baseline Profiles for Performance
Memory and APK size are not the only performance concerns.
Startup time and runtime performance are also important.
Android supports Baseline Profiles, which can help optimize frequently executed application code.
Baseline Profiles allow developers to communicate important execution paths to the Android Runtime, potentially improving startup and runtime performance.
Android’s official performance documentation provides guidance on Baseline Profiles and application optimization.
This is a good example of why application optimization should be treated as a complete discipline rather than focusing only on file size.
Monitor Performance in Production
Optimization should not end when the application is released.
Real users can expose problems that are difficult to reproduce locally.
Monitor important indicators such as:
- Crash rates
- Out-of-memory errors
- Application startup time
- ANR events
- Battery usage
- Download size
- User retention
Android’s performance tooling and Google Play reporting capabilities can help developers understand how applications behave across different devices and environments.
The best optimization decisions are based on evidence.
A Practical Android Optimization Workflow
A reliable optimization process can follow these steps:
Step 1: Measure
Determine the current memory usage, startup performance, and application size.
Step 2: Identify the Biggest Problems
Do not optimize everything at once.
Find the areas producing the greatest user impact.
Step 3: Fix Memory Leaks
Use Android Studio’s profiling tools to identify objects that remain in memory unexpectedly.
Step 4: Optimize Images
Resize, compress, and load images efficiently.
Step 5: Review Dependencies
Remove obsolete or unnecessary libraries.
Step 6: Enable Release Optimization
Use R8 and resource shrinking where appropriate.
Step 7: Analyze the Application Package
Inspect the contents of your APK or App Bundle to identify unusually large files.
Step 8: Test
Verify that optimization has not introduced crashes or missing resources.
Step 9: Measure Again
Compare the results with the original baseline.
This final step is important.
If you do not measure the result, you cannot confidently say that an optimization worked.
Common Android Optimization Mistakes
Optimizing Without Measuring
A developer may spend hours optimizing code that was never a performance problem.
Always profile first.
Removing Useful Dependencies Just to Reduce Size
Application size matters, but security and maintainability matter too.
Do not remove a valuable dependency merely because it adds a small amount of size.
Loading Full-Resolution Images
This is a common source of unnecessary memory consumption.
Use appropriately sized images.
Keeping Large Objects in Memory
Do not keep data in memory indefinitely when it can be loaded when required.
Ignoring Low-End Devices
An application that works perfectly on a powerful development computer may behave differently on older or memory-constrained devices.
Test across a representative range of hardware.
Best Practices for Android Memory and APK Optimization
For a strong long-term strategy, remember these principles:
- Measure before optimizing.
- Use Android Studio Profiler tools to investigate memory problems.
- Avoid unnecessary references to Activity and Context objects.
- Load images at appropriate sizes.
- Use efficient list rendering.
- Keep caches under control.
- Remove unused resources and dependencies.
- Enable R8 and resource shrinking for suitable release builds.
- Use Android App Bundles for Google Play distribution.
- Analyze APK and bundle contents regularly.
- Test release builds after optimization.
- Monitor real-world performance after deployment.
Conclusion
Optimizing Android app memory management and reducing APK size are important parts of building high-quality Android applications.
Memory optimization helps applications remain responsive and reduces the risk of memory-related crashes. APK and download-size optimization can make installation and updates more convenient, especially for users with limited storage or slower network connections.
The most effective approach is not to make random changes in search of better performance. Instead, developers should measure application behavior, identify the largest problems, apply targeted improvements, and measure the results again.
Tools such as Android Studio Profiler, R8, resource shrinking, Android App Bundles, and Baseline Profiles provide valuable support for this process.
Ultimately, optimization is about the user experience. A smaller application that starts quickly, uses memory responsibly, responds smoothly, and avoids unnecessary downloads is more likely to feel reliable and polished.
By treating Android memory management, APK size optimization, resource efficiency, dependency management, and runtime performance as connected parts of application quality, developers can build Android apps that remain efficient and maintainable as they grow.
Trusted Sources and Further Reading
- Android Developers — Performance: Official Android guidance covering application performance and optimization.
https://developer.android.com/topic/performance - Android Developers — Memory Profiler: Official documentation for analyzing application memory usage with Android Studio.
https://developer.android.com/studio/profile/memory-profiler - Android Developers — Reduce APK Size: Official guidance for reducing application size and optimizing resources.
https://developer.android.com/topic/performance/reduce-apk-size - Android Developers — App Optimization: Official guidance covering R8, shrinking, and release optimization.
https://developer.android.com/topic/performance/app-optimization/enable-app-optimization - Android Developers — Android App Bundles: Official documentation explaining Android App Bundle publishing and optimized delivery.
https://developer.android.com/guide/app-bundle - Android Developers — Baseline Profiles: Official documentation for improving application startup and runtime performance.
https://developer.android.com/topic/performance/baselineprofiles/overview - Android Developers — ViewModel: Official guidance on managing UI-related data using the Android ViewModel architecture component.
https://developer.android.com/topic/libraries/architecture/viewmodel
About The Author